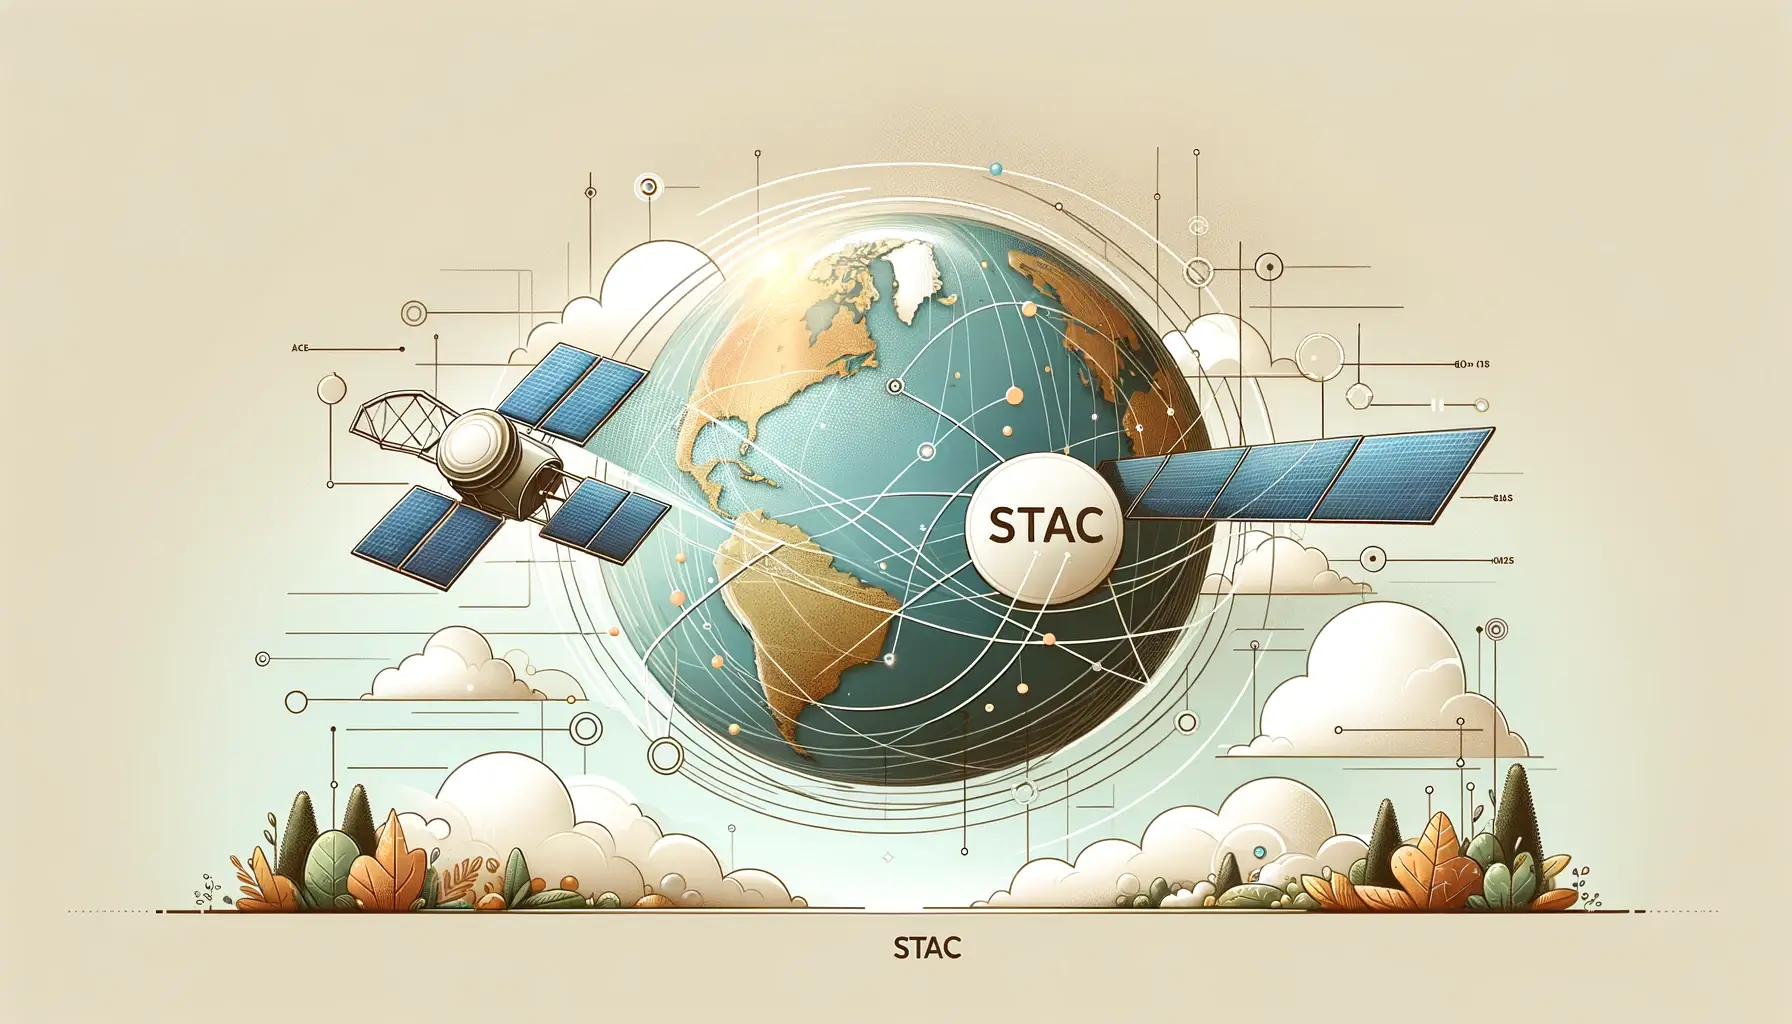
STAC: Transforming Remote Sensing Data Management.
Published on Feb 18, 2024 | Bikesh Bade | 677 views
Is STAC the next big thing in remote sensing data, it certainly has the potential to play a significant role in the future of geospatial data management and analysis.
Google Earth Engine: Disadvantages and Limitation
Published on Apr 27, 2022 | Bikesh Bade | 5134 views
As Google Earth Engine is getting popular in geoscience and data computation, there are a few things that need to consider before you deep dive. This blog will highlight some of the GEE's limitations and disadvantages. Importantly, Google Earth Engine is free only for non-commercial, non-production use, This means its sole purpose is to serve the educational professional, students, and the nonprofit organization.
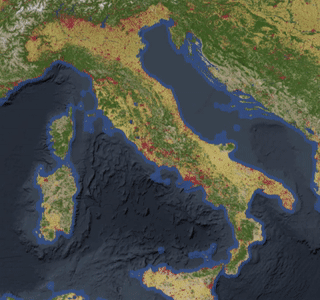
ESRI 10m Land Cover 2020 in GEE
Published on Jul 19, 2021 | Bikesh Bade | 4227 views
ESRI 10-meter resolution map of Earth’s land surface from 2020 with High-resolution, open, accurate, comparable, and timely land cover maps in GEE
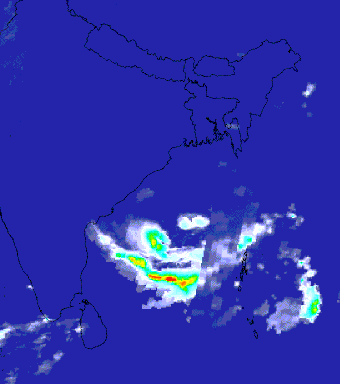
Google Earth Engine tip 2 (Cyclone Thumnail)
Published on May 27, 2021 | Bikesh Bade | 1834 views
The Indian Ocean cyclone season has no official bounds, but cyclones tend to form between April and December, with the peak from May to November. With Google Earth Engine you can create and visualize the cyclone in the video for a particular day.
Google Earth Engine tip 1 (clipping)
Published on May 26, 2021 | Bikesh Bade | 11805 views
Google Earth Engine (GEE) Tips provide a foundation to quickly begin learning and using GEE. If you are new to GEE, you will want to know small and handy tips.
Awesome facts about Satellites
Published on May 20, 2021 | Bikesh Bade | 10851 views
Sputnik 1 was the first satellite in space. The Soviet Union launched it in 1957.
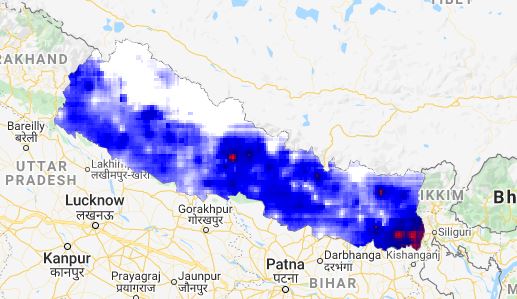
Extract CHIRPS rainfall data in excel for given survey points
Published on Nov 28, 2020 | Bikesh Bade | 4839 views
Climate Hazards Group InfraRed Precipitation with Station data (CHIRPS) is a 35+ year quasi-global rainfall data set. These tutorials provide a brief idea on how to extract the rainfall data for a given survey point from the CHIRPS global rainfall data set.
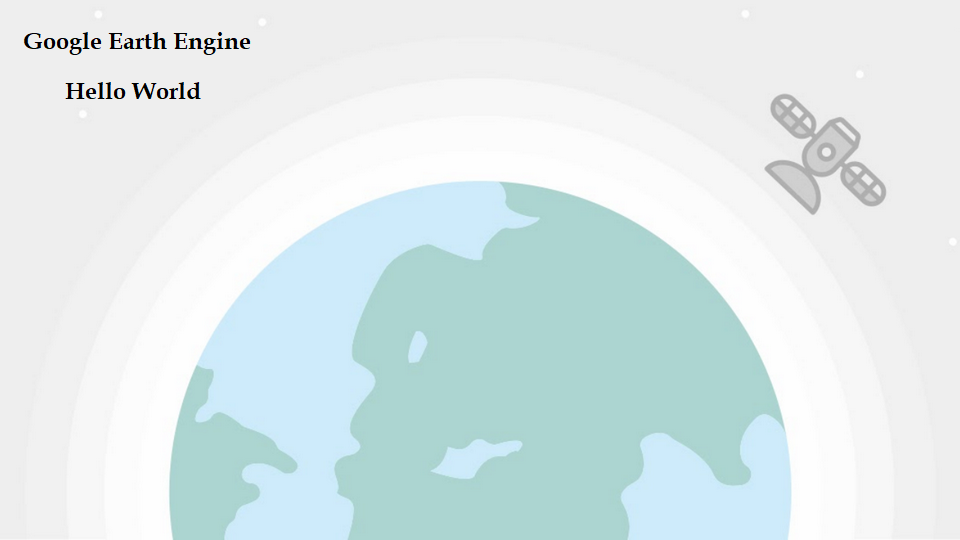
Google Earth Engine - Hello World
Published on Sep 20, 2020 | Bikesh Bade | 1970 views
Time to write your first JavaScript for Earth Engine! In your Chrome browser, go to code.earthengine.google.com and copy the following into the Code Editor
NDVI time series with Google Earth Engine
Published on Sep 19, 2020 | Bikesh Bade | 7530 views
Time series animations of Earth observation imagery are captivating and engaging. In this tutorial, you'll learn how to generate an animated GIF.
Learn Google Earth Engine from Scratch
Published on Sep 18, 2020 | BIkesh Bade | 5486 views
Google Earth Engine is a geospatial processing service with the motto "To organize the world's information and make it universally accessible and useful."
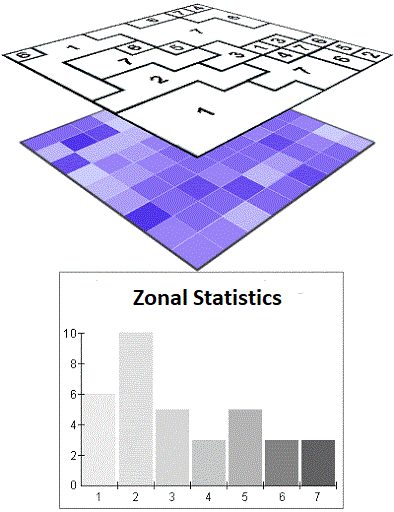
Calculate Zonal Statistics and export as CSV
Published on Jul 10, 2020 | Bikesh Bade | 7233 views
Get statistics in each zone of the image or image collection in google earth engine and export the data in CSV. Statistics are simple tools that help us for a better understanding of our images. Spatial statistics is one of the most rapidly growing areas of statistics.
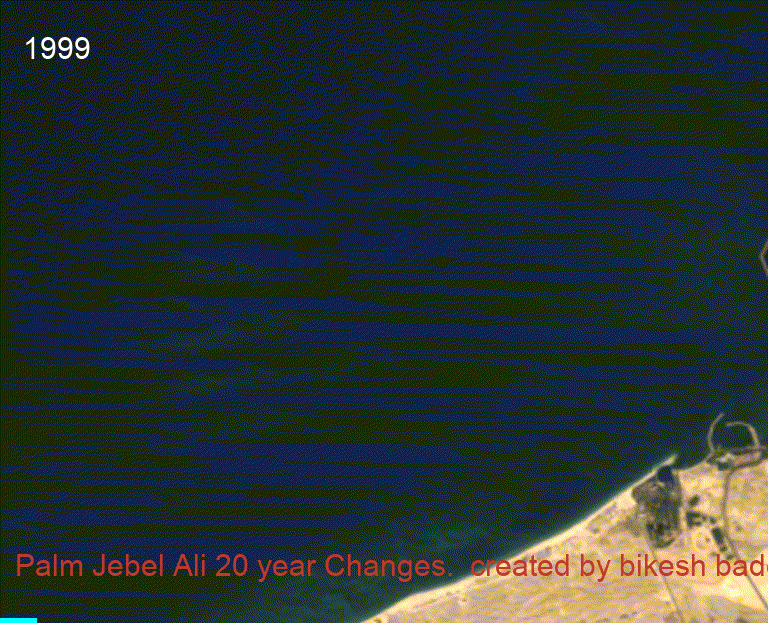
20 year Time-series change of Mega projects
Published on Jun 09, 2020 | Bikesh Bade | 1652 views
20 year Time series analysis of megaproject using Landsat satellite.
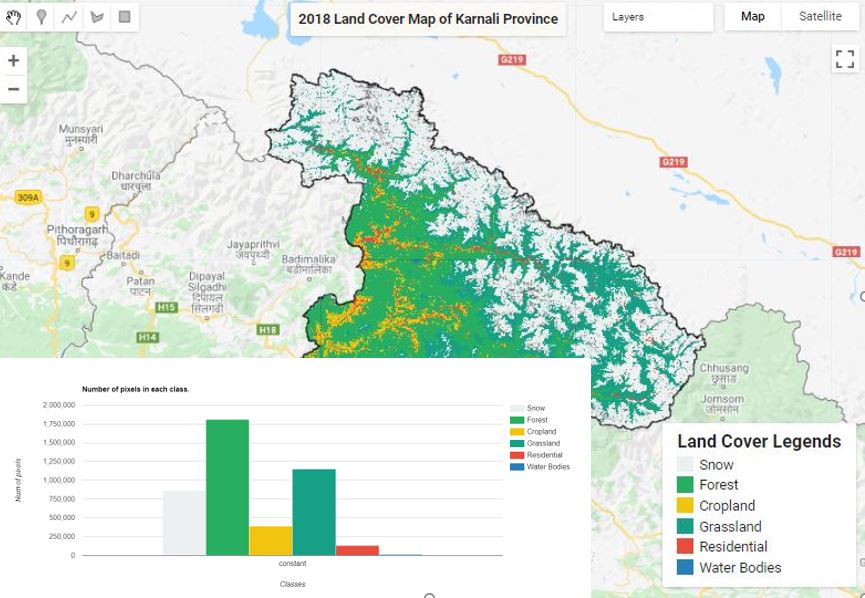
Land Cover Mapping - Part 4 (Analyze Statistics)
Published on Jun 08, 2020 | Bikesh Bade | 4093 views
Statistics are simple tools that helps us for a better understanding of our images. Spatial statistics is one of the most rapidly growing areas of statistics.
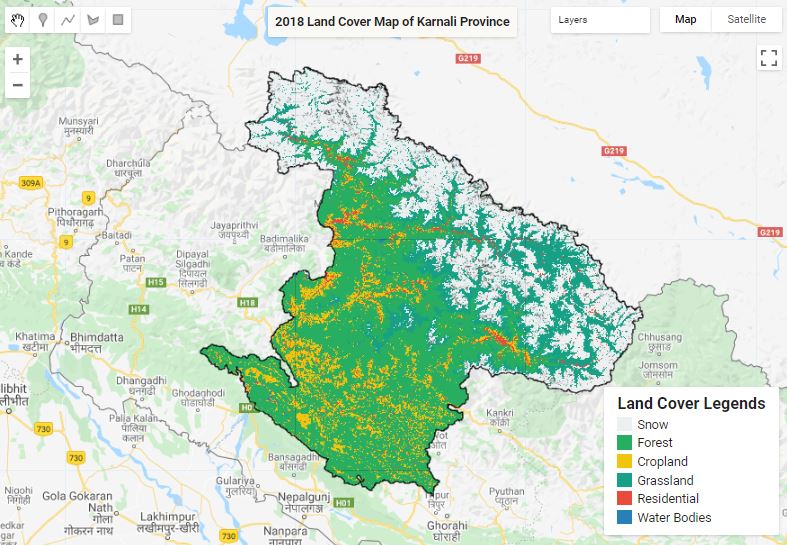
Land Cover Mapping - Part 3 (Validation)
Published on Jun 04, 2020 | Bikesh Bade | 3984 views
The surface of the Earth is continuously changing at many levels; local, regional, national, and global scales. Changes in land use and land cover are pervasive, rapid, and can have significant impacts on people, the economy, and the environment.

Land Cover Mapping - Part 2
Published on May 31, 2020 | Bikesh Bade | 3231 views
The surface of the Earth is continuously changing at many levels; local, regional, national, and global scales. Changes in land use and land cover are pervasive, rapid, and can have significant impacts on people, the economy, and the environment.
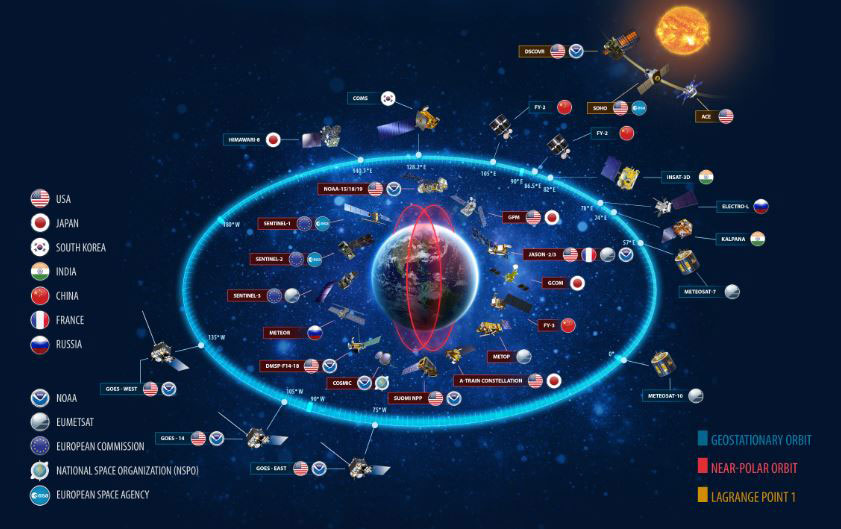
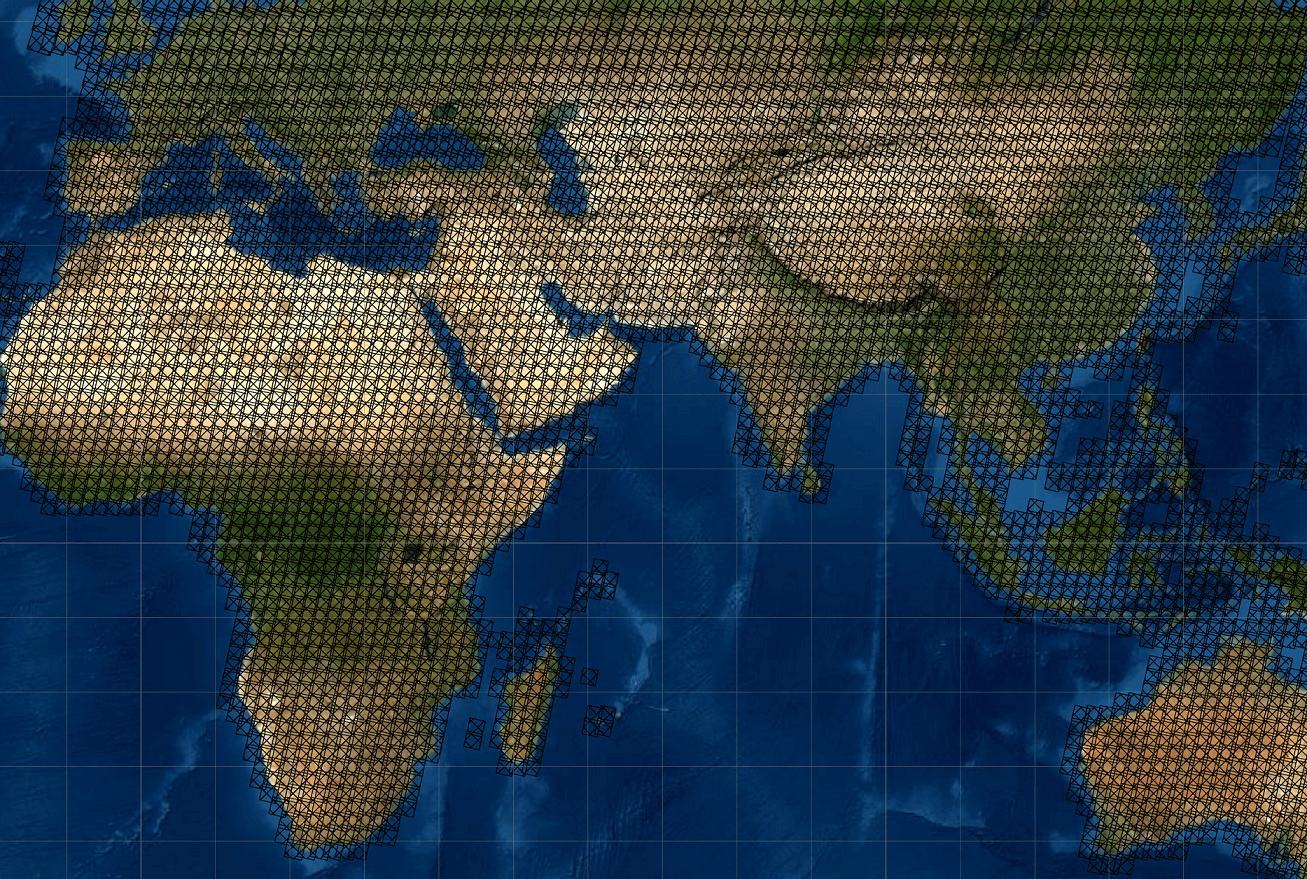
Live satellite Position | Explore the sky roads
Exploring Earth from Above: Where Satellites Meet Geography

Being drunk
Published on Nov 06, 2022 | Bikesh Bade | 481 views
Yeah, it feels awesome. All the high school science classes come to real; Earth does rotate, and gravity is damn strong.

Fourteen Street floks
Published on Nov 06, 2022 | Bikesh Bade | 511 views
Warm lights hit the frozen fur welcoming dawn in the autumn and a silent breeze to the ear awakes the soul. Bask with the first light, and roll on the back to feel the heat.

Rowdy Panda
Published on Jun 30, 2022 | Bikesh Bade | 589 views
We are living in the golden generation of the human civilization Yet, when it comes to friendship, there are no clear rules or straight road. Friendship is always dilemma and full of tricks and advice also differs from person to person. Connections and friends are an important part of living a happy and fulfilled life. This is the story of friendship and craziness.

Living Alone for The First Time
Published on Apr 10, 2022 | Bikesh Bade | 3226 views
Living alone is a totally new experience. A long journey comes with surprises, ups, and downs. also made me realize, that adulthood can sometimes be pretty lonely.
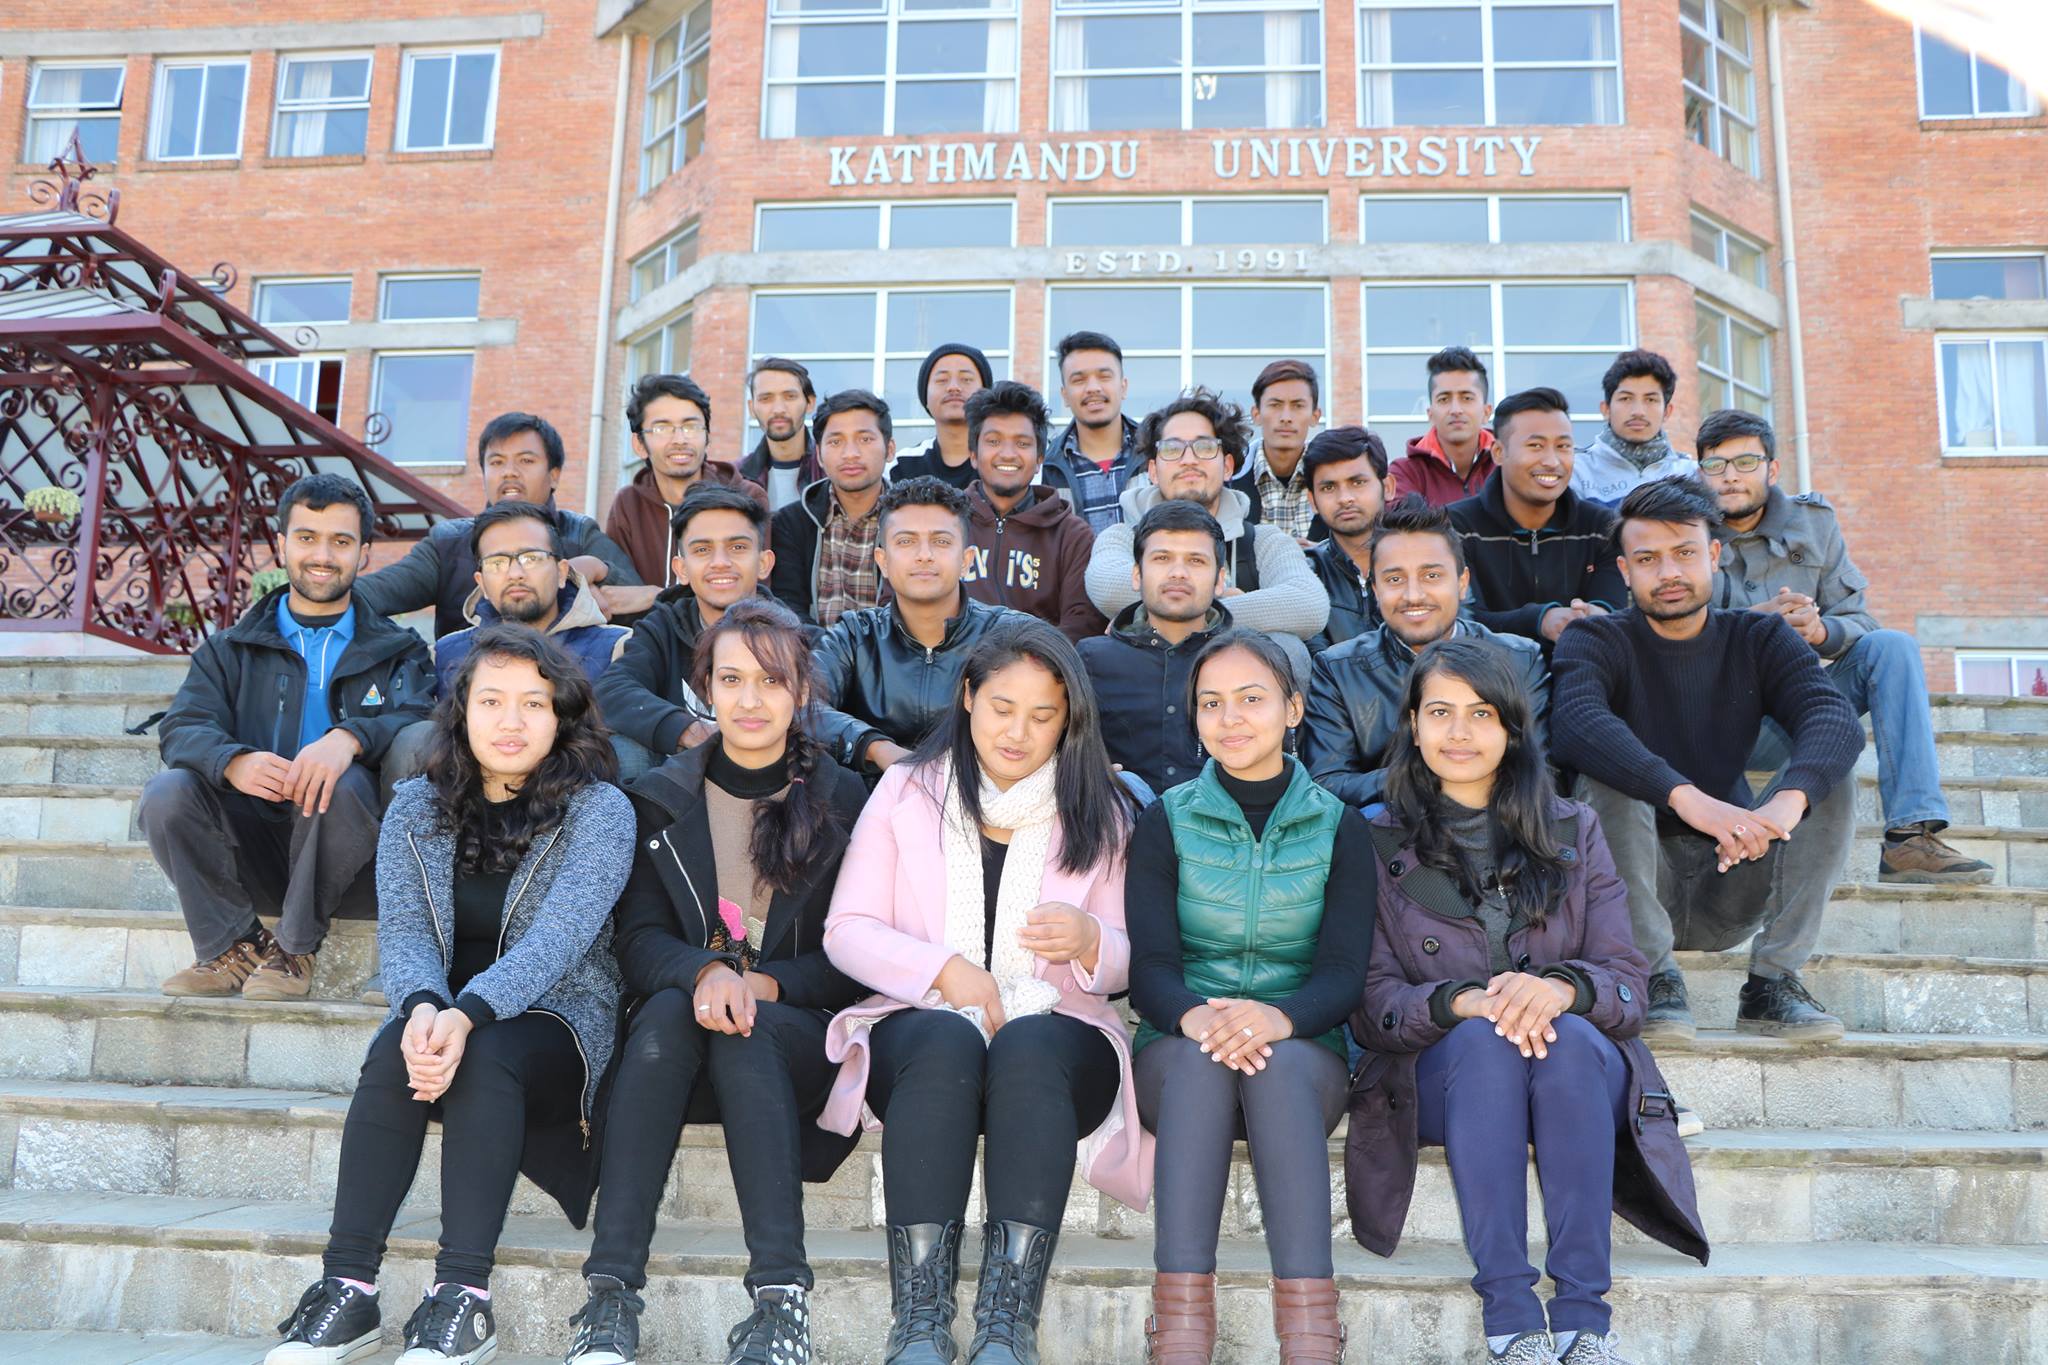
Geomatics Batch 2013
Published on Feb 21, 2022 | Bikesh Bade | 687 views
Dozens of family name, blend to a perfect GE assortment,

Moving to the United Arab Emirates
Published on Jan 20, 2022 | Bikesh Bade | 759 views
Every journey has its own story, my journey to UAE begin with dreams and fear. life is all about connecting dots in between connected dots we grow up. sometimes gap between dots are small and some time gap is huge. this was that huge gap in my life to connect dream and to rewrite definition of fear.

Let all emotion get release
Published on Jun 15, 2021 | Pratima Baral | 933 views
Lost in the space of silence With a depressed heart, Lonely and empty,

Again, the night is here!
Published on Jun 02, 2021 | Pratima Baral | 1031 views
Shhhhhh, Again the night is here, Again the silence are here,
Being a product Engineer at ESRI
Published on Mar 08, 2021 | Bikesh Bade | 1573 views
Being part of Esri for me is something like traveling the world from my desk. Especially when you work on the Satellite imagery team, you virtually around the world with different artificial eyes (satellite sensors).

Being an engineering student
Published on May 31, 2020 | Bikesh Bade | 1465 views
So what is like to be an engineer? Obviously it’s the dream.