NDVI time series with Google Earth Engine
Published on Sep 19, 2020 | Bikesh Bade | 7173 Views
Time is an important component of many spatial datasets. Along with location information, time providers another dimension for analysis and visualization of data. If you are working with a dataset that contains timestamps or has observations recorded at multiple time-steps, you can easily visualize a time animation allows you to control the time of the display (map, scene, or globe).
Time Series Benefits and Applications
-
Trendalyzer
-
The fastest technique for presentation
-
Visualize multi-dimensional data
-
Ecosystem Analysis
-
Time trend analysis and change detection
-
Flood hazard animation
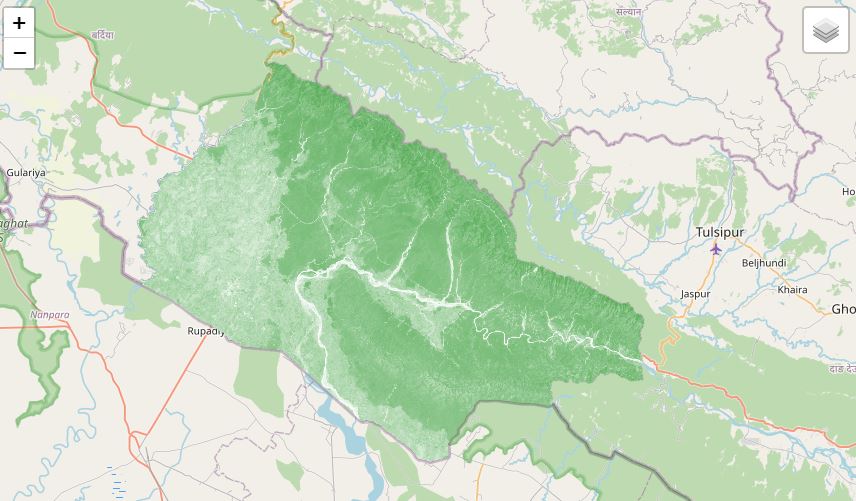
Study Area - The Hindu Kush-Himalayan region
The Hindu Kush-Himalayan region is the home of a series of the highest mountains on earth, including the world's highest and prominent peaks, Mt. Everest (8,850 m, Nepal) and K2 (8,611 m, Pakistan). At least more than 30 peaks in the Himalayas exceed 7,620 m. The Hindu Kush-Himalayan region is separated for most of its length into two parallel and longitudinal mountain ranges due to the erosive power of the rivers Indus and Brahmaputra, each of which is characterized by mountain catchments of about 160,000 km². The range north of the Indus and Brahmaputra is called the High Himalayas. The southern range is subdivided into three parallel zones: the High Mountains, the Middle Mountains, and the Siwaliks. Finally, the HKH region borders on lowlands in the south.
Forest or vegetation cover are important physiographic characteristics of the Hindu Kush-Himalayan region. From north to south the following ecoregions occur with an emphasis on wooded vegetation: Temperate mountain, Subtropical mountain, Tropical mountain, Tropical rainforest, and Tropical moist deciduous forest.
Satellite Image for the Study
MODIS is a moderate resolution satellite imaging system and NDVI is a common reflectance-based vegetation index. The Earth Engine Data Catalog provides NDVI as a precalculated dataset for convenience. In the above animation, NDVI is mapped to a color gradient from tan to dark green representing low to high photosynthetic capacity (low to high vegetation cover/density/productivity).
Workflow
The basic workflow is as follows:
-
Fetch the MODIS vegetation indices dataset and subset the NDVI band
-
Define a region of interest and animation frame geometries
-
Group images from the same annual 16-day composite window using a join
-
Reduce the composite groups by median to produce animation frames
-
Define visualization parameters and convert data into RGB visualization images
-
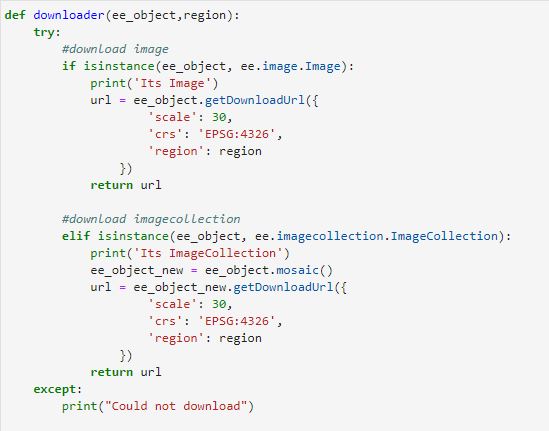
Generate a URL that will produce a GIF in the browser
Create an animated GIF
In google earth engine getVideoThumbURL is the method that will create an animation from the collection of RGB visualization images generated in the previous step. Relevant parameters include:
-
region: set to the region -
dimensions: set to 600 which defines the larger dimension of the resulting GIF as 600px (the smaller dimension is proportionally scaled) -
crs: set to 'EPSG:3857' to match the coordinate reference system of the Code Editor map -
framesPerSecond: set to 10 (frames per second 0.2 to120)
Google Earth Engine Code
// data for the Study
var startDate = '2015-01-01';
var endDate = '2020-01-01';


//study Area
var studyArea = HKH_region // upload or link the HKH region or the region you wish to create time series animation


// Fetch a MODIS NDVI collection and select NDVI.
var dataset = ee.ImageCollection('MODIS/006/MOD13Q1').select('NDVI');


// Define the regional bounds of animation frames matched to study area
var region = ee.Geometry.Polygon(
  [[[60.853882, 15.957886],
    [105.044678, 39.318726],
    [60.853882, 15.957886],
    [105.044678, 39.318726]]],
  null, false
);


// Add day-of-year (DOY) property to each image.
var col = dataset.map(function(img) {
  var doy = ee.Date(img.get('system:time_start')).getRelative('day', 'year');
  return img.set('doy', doy);
});


// Get a collection of distinct images by 'doy'.
var distinctDOY = col.filterDate(startDate, endDate);


// Define a filter that identifies which images from the complete
// collection match the DOY from the distinct DOY collection.
var filter = ee.Filter.equals({leftField: 'doy', rightField: 'doy'});


// Define a join.
var join = ee.Join.saveAll('doy_matches');


// Apply the join and convert the resulting FeatureCollection to an
// ImageCollection.
var joinCol = ee.ImageCollection(join.apply(distinctDOY, col, filter));


// Apply median reduction among matching DOY collections.
var comp = joinCol.map(function(img) {
  var doyCol = ee.ImageCollection.fromImages(
    img.get('doy_matches')
  );
  return doyCol.reduce(ee.Reducer.median());
});


// Define RGB visualization parameters.
var visParams = {
  min: 0.0,
  max: 9000.0,
  palette: [
    'FFFFFF', 'CE7E45', 'DF923D', 'F1B555', 'FCD163', '99B718', '74A901',
    '66A000', '529400', '3E8601', '207401', '056201', '004C00', '023B01',
    '012E01', '011D01', '011301'
  ],
};


// Create RGB visualization images for use as animation frames.
var rgbVis = comp.map(function(img) {
  return img.visualize(visParams).clip(studyArea);
});


// Define GIF visualization arguments.
var gifParams = {
  'region': region,
  'dimensions': 600,
  'crs': 'EPSG:3857',
  'framesPerSecond': 120,
  'format': 'gif'
};


// Print the GIF URL to the console.
print(rgbVis.getVideoThumbURL(gifParams));


// Render the GIF animation in the console.
print(ui.Thumbnail(rgbVis, gifParams));
Responses

Bhaskar Shrestha
Thanks a lot for your effort. How about adding the code for time as well to the animation?
- Aug 29, 2022 |