Land Cover Mapping - Part 4 (Analyze Statistics)
Published on Jun 08, 2020 | Bikesh Bade | 3925 Views
Statistics are simple tools that helps us for a better understanding of our images. Spatial statistics is one of the most rapidly growing areas of statistics.
How to get Statistics of the Classified Image?
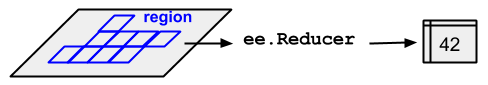
To get statistics of classified image and its pixel values in a region, google earth engine use image.reduceRegion(). This reduces all the pixels in the region(s) to a statistic or other compact representation of the pixel data in the region (e.g. histogram). The region is represented as a Geometry, which might be a polygon, containing many pixels, or it might be a single point, in which case there will only be one pixel in the region.
Pixels in the region
Pixels are determined to be in the region (and weighted) according to the following rules, applied in the specified scale and projection:
- Unweighted reducers
- ee.Reducer.count() or
- ee.Reducer.mean().unweighted()
- pixels are included if their centroid is in the region and the image's mask is non-zero.
- Weighted reducers
- (e.g. ee.Reducer.mean())
- pixels are included if at least (approximately) 0.5% of the pixel is in the region and the image's mask is non-zero
- their weight is the minimum of the image's mask and the (approximate) fraction of the pixel covered by the region.
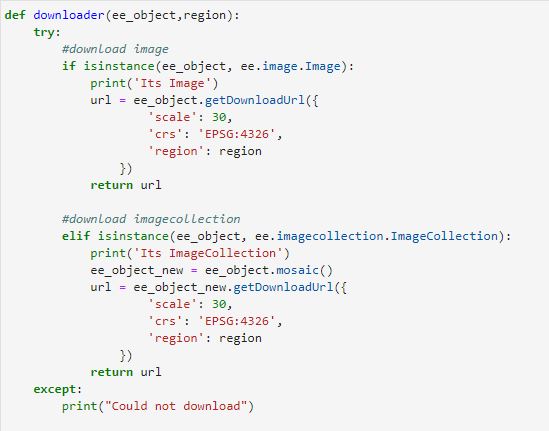
//classified is the image that is classified using any Machine learning
var stats = classified.reduceRegion({
  reducer: ee.Reducer.count(), //Gives you the count it has other variable like sum()
  geometry: studyArea,
  scale: 30
});
print(stats);
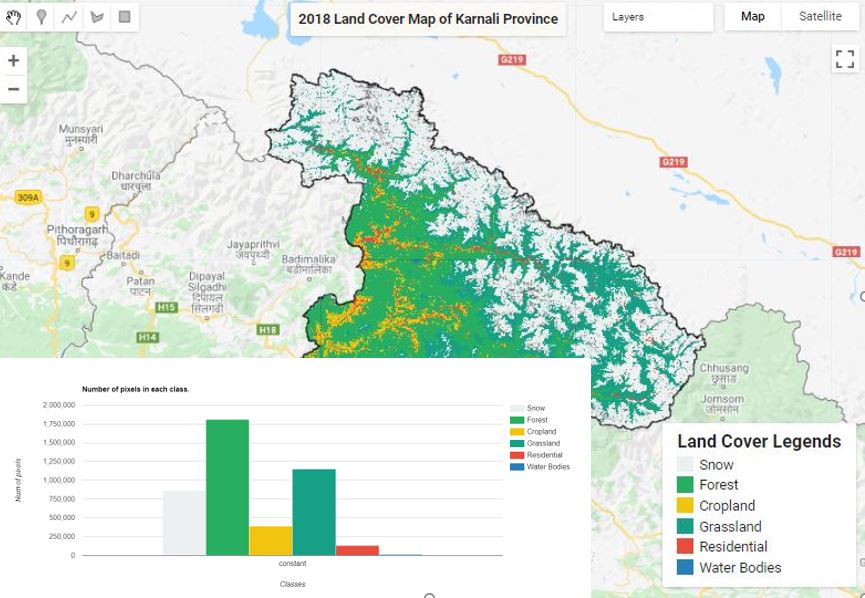
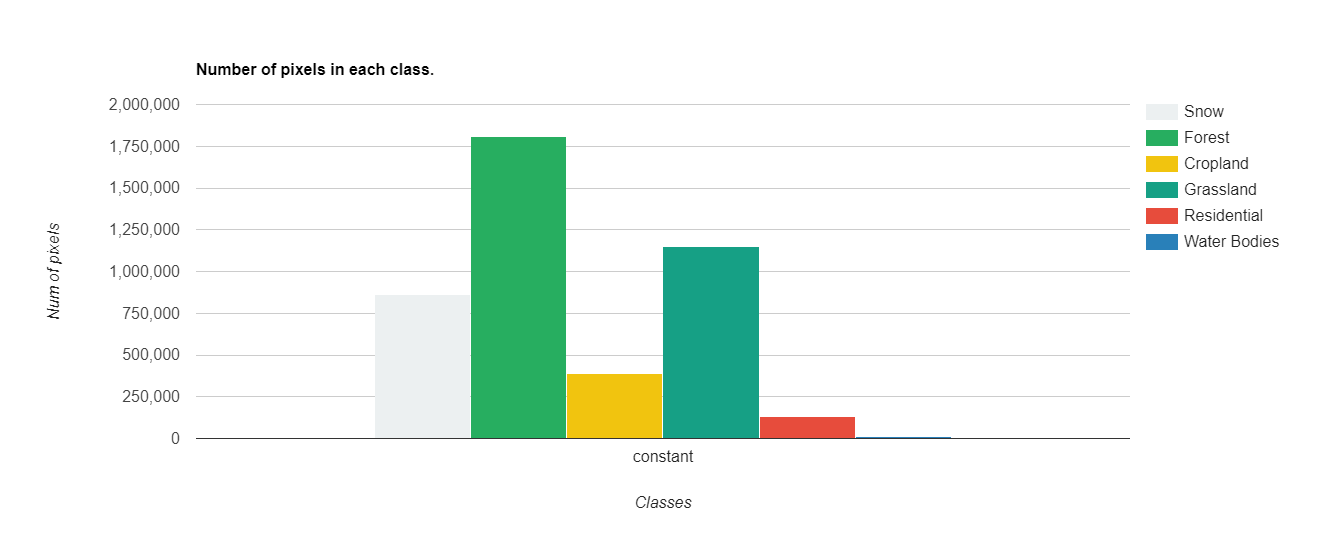
Get Number of pixels in each class of classified image with the histogram
var options = {
lineWidth: 1,
pointSize: 2,
hAxis: {title: 'Classes'},
vAxis: {title: 'Num of pixels'},
title: 'Number of pixels in each class.', // title
colors:['#ecf0f1','#27ae60', '#f1c40f','#16a085','#e74c3c','#2980b9'], //color pallete

};


//create a histogram with pixel count of each class
var pixelChart = ui.Chart.image.byClass({
  image: ee.Image(1).addBands(classified),
  classBand: 'classification',
  region: studyArea,
  scale: 90,
  reducer: ee.Reducer.count() //Gives you the count it has other variable like sum()
}).setSeriesNames(['Snow', 'Forest', 'Cropland','Grassland', 'Residential', 'Water Bodies' ])
.setOptions(options);

print(pixelChart)
Get area of each class just by multiplying with 30 *30 in case of lansat
Responses

John Ogbodo
Many thanks for your mentoring. I would like to learn on you to become an Google engine expert. What will that cost me? John
- Jun 08, 2020 |