Calculate Zonal Statistics and export as CSV
Published on Jul 10, 2020 | Bikesh Bade | 7636 Views
Statistics are simple tools that help us for a better understanding of our images. Spatial statistics is one of the most rapidly growing areas of statistics.
The Zonal Statistics as Table tool in ArcGIS calculates all, a subset, or a single statistic that is valid for the specific input but returns the result as a table instead of an output raster. A zone is all the cells in a raster that have the same value, whether or not they are contiguous. The input zone layer defines the shape, values, and locations of the zones. An integer field in the zone input is specified to define the zones. A string field can also be used. Both raster and feature datasets can be used as the zone dataset.
How to get Zonal Statistics of the Image in Google Earth Engine the same as ArcGIS Tool?
To get statistics of classified image and its pixel values in a region, google earth engine use image.reduceRegion(). This reduces all the pixels in the region(s) to a statistic or other compact representation of the pixel data in the region (e.g. histogram). The region is represented as a Geometry, which might be a polygon, containing many pixels, or it might be a single point, in which case there will only be one pixel in the region.
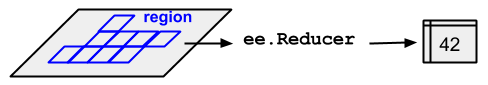
Pixels in the region
Pixels are determined to be in the region (and weighted) according to the following rules, applied in the specified scale and projection:
- Unweighted reducers
- ee.Reducer.count() or
- ee.Reducer.mean().unweighted()
- pixels are included if their centroid is in the region and the image's mask is non-zero.
- Weighted reducers
- (e.g. ee.Reducer.mean())
- pixels are included if at least (approximately) 0.5% of the pixel is in the region and the image's mask is non-zero
- their weight is the minimum of the image's mask and the (approximate) fraction of the pixel covered by the region.
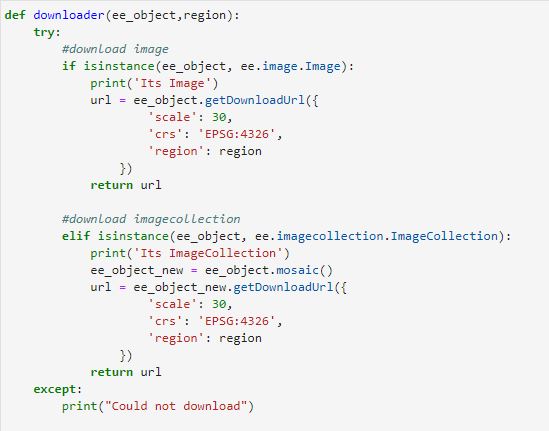
//zonal statistics of the image
var reduced= classified.reduceRegion({
  reducer: ee.Reducer.mean(), //Gives you the mean, it has other variable like sum min max
  collection: Surveydata,
  scale: 30
});

print(reduced);


// the resulting mean is a FeatureCollection
// so you can export it as a table
Export.table.toDrive({
    collection: reduced,
    description: 'zonal',
    folder: 'GEE',
    fileNamePrefix: 'statName',
    fileFormat: 'CSV'
})
Example to demonstrate the Zonal Statistic of NDVI values of all the survey point in the Landsat image and export the table to drive as CSV
// study area and survey data
var studyArea = ee.FeatureCollection(studyarea);
var surveyData = ee.FeatureCollection(surveydata);


// Date
var startyear = 2019;
var endyear = 2019;

// Date object
var startDate = ee.Date.fromYMD(startyear,5,1);
var endDate = ee.Date.fromYMD(endyear,9,30);

//  Normalized difference vegetation index (NDVI)
function getNDVI(image) {
    var ndvi = image.normalizedDifference(['nir','red']).rename("ndvi");
    image = image.addBands(ndvi);
    return image;
}


// Band names //
var inBandsL08 = ee.List([1,2,3,4,5,7,6,'pixel_qa']);
var outBandsL08 = ee.List(['blue','green','red','nir','swir1','temp','swir2','pixel_qa']);

//import landsat 8 (year 2013 - Present)
var l8s = ee.ImageCollection("LANDSAT/LC08/C01/T1_SR")
                  .filterDate(startDate,endDate)
                  .filterBounds(studyArea)
                  .select(inBandsL08,outBandsL08)
                  .filter(ee.Filter.lt("CLOUD_COVER",20));

var study = l8s.map(getNDVI);
print('images')
print(study.first())


// map to map layers
study = study.median().clip(studyArea)
Map.centerObject(studyArea);
Map.addLayer(study, {'min':0,'max':3000,'bands':"red,green,blue"}, "landsat");


// for ndvi
var Vis = {
  min: 0.0,
  max: 0.8,
  palette: [
    'FFFFFF', 'CE7E45', 'DF923D', 'F1B555', 'FCD163', '99B718', '74A901',
    '66A000', '529400', '3E8601', '207401', '056201', '004C00', '023B01',
    '012E01', '011D01', '011301'
  ],
};


// NDVI to map layers
var studyNDVI = study.select('ndvi');
print(studyNDVI);
Map.addLayer(studyNDVI, Vis, 'NDVI');


// Survey data to map layers
Map.addLayer(surveyData,{color:'FF0000'},'surveyData');


// Get Zonal Statistics
var reduced = studyNDVI.reduceRegions({
  collection: surveyData,
  reducer: ee.Reducer.mean(),
  scale: 30,
});

print(reduced);


// the resulting mean is a FeatureCollection
// so you can export it as a table
Export.table.toDrive({
    collection: reduced,
    description: 'NDVI',
    folder: 'GEE',
    fileNamePrefix: 'NDVI',
    fileFormat: 'CSV'
})
Responses

Raechel Portelli
Thank you for posting this. It was the clearest and simplest explanation and code set for this procedure. I appreciate it!
- Feb 01, 2021 |
Iqra basit
Thankyou for your code. but it give zonal statistics for only one image. how to iterate the code
- Jun 04, 2021 |
Admin
you can use map function in GEE iterate
- Jun 14, 2021 |