Beginner guide to python Folium module to integrate google earth engine
Published on Apr 12, 2020 | Bikesh Bade | 19609 Views
Folium makes it easy to visualize data that’s been manipulated in Python on an interactive leaflet map. The library has a number of built-in tilesets from OpenStreetMap, Mapbox, and Stamen, and supports custom tilesets with Mapbox or Cloudmade API keys. folium supports both Image, Video, GeoJSON, and TopoJSON overlays.
Install Folium as PIP
pip install folium
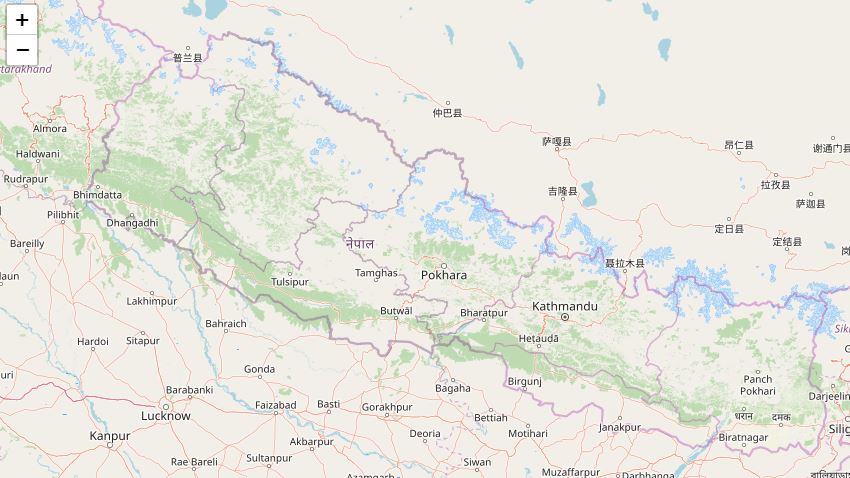
To create a base map, simply pass your starting coordinates to Folium:
#import module
import folium

#create folium object
my_map= folium.Map(location=[26.5236, 85.6750])
To save it in a file,
my_map.save('index.html')
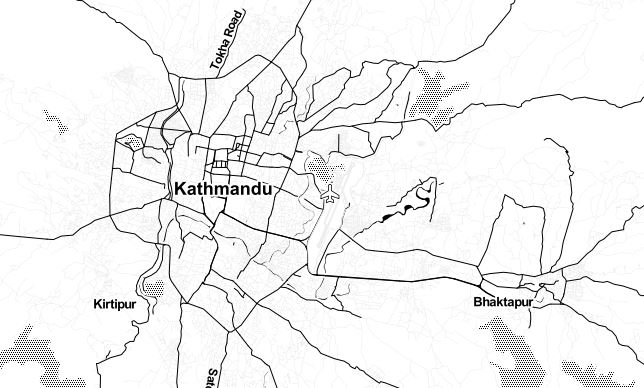
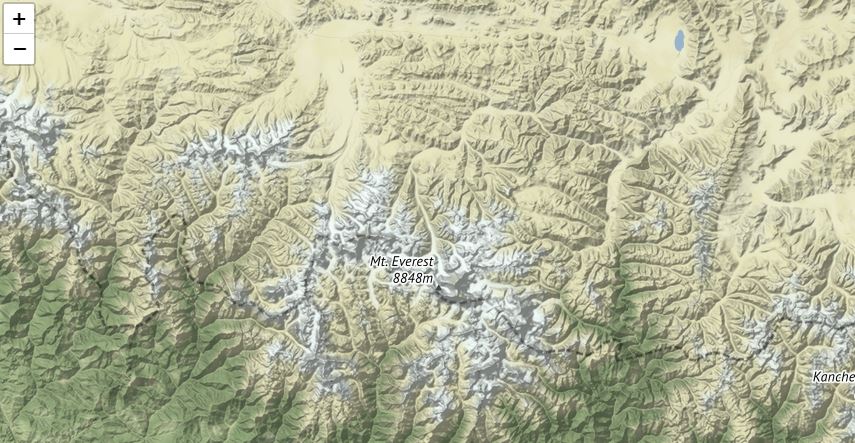
The default tiles are set to OpenStreetMap, but Stamen Terrain, Stamen Toner, Mapbox Bright, and Mapbox Control Room, and many other tiles are built-in.
#To create Terrain map
my_map = folium.Map(
    location=[26.5236, 85.6750],
    zoom_start=12,
    tiles='Stamen Terrain'
)
To add custom base maps to folium
# Add custom base maps to folium
basemaps = {
    'Google Maps': folium.TileLayer(
        tiles = 'https://mt1.google.com/vt/lyrs=m&x={x}&y={y}&z={z}',
        attr = 'Google',
        name = 'Google Maps',
        overlay = True,
        control = True
    ),
    'Google Satellite': folium.TileLayer(
        tiles = 'https://mt1.google.com/vt/lyrs=s&x={x}&y={y}&z={z}',
        attr = 'Google',
        name = 'Google Satellite',
        overlay = True,
        control = True
    ),
    'Google Terrain': folium.TileLayer(
        tiles = 'https://mt1.google.com/vt/lyrs=p&x={x}&y={y}&z={z}',
        attr = 'Google',
        name = 'Google Terrain',
        overlay = True,
        control = True
    ),
    'Google Satellite Hybrid': folium.TileLayer(
        tiles = 'https://mt1.google.com/vt/lyrs=y&x={x}&y={y}&z={z}',
        attr = 'Google',
        name = 'Google Satellite',
        overlay = True,
        control = True
    ),
    'Esri Satellite': folium.TileLayer(
        tiles = 'https://server.arcgisonline.com/ArcGIS/rest/services/World_Imagery/MapServer/tile/{z}/{y}/{x}',
        attr = 'Esri',
        name = 'Esri Satellite',
        overlay = True,
        control = True
    )
}

# Add custom basemaps
basemaps['Google Maps'].add_to(my_map)
basemaps['Google Satellite Hybrid'].add_to(my_map)
To add the tools in the map
#import plugins
from folium import plugins

# Add a layer control panel to the map.
my_map.add_child(folium.LayerControl())

#fullscreen
plugins.Fullscreen().add_to(my_map)

#GPS
plugins.LocateControl().add_to(my_map)

#mouse position
fmtr = "function(num) {return L.Util.formatNum(num, 3) + ' º ';};"
plugins.MousePosition(position='topright', separator=' | ', prefix="Mouse:",lat_formatter=fmtr, lng_formatter=fmtr).add_to(my_map)

#Add the draw
plugins.Draw(export=True, filename='data.geojson', position='topleft', draw_options=None, edit_options=None).add_to(my_map)

#Add measure tool
plugins.MeasureControl(position='topright', primary_length_unit='meters', secondary_length_unit='miles', primary_area_unit='sqmeters', secondary_area_unit='acres').add_to(my_map)
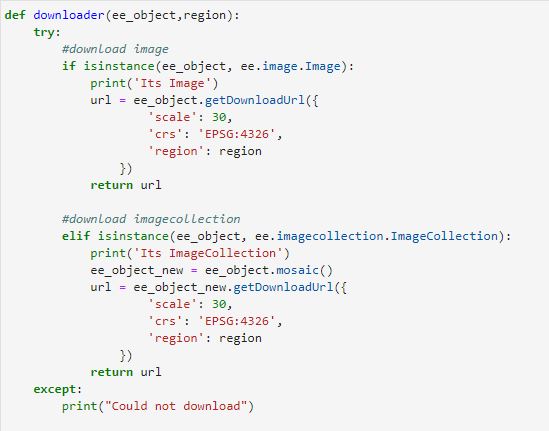
Next step is to create the function to add the GEE image and image collections to the folium
# Define a method for displaying Earth Engine image tiles on a folium map.
def add_ee_layer(self, ee_object, vis_params, name):

    try:
        # display ee.Image()
        if isinstance(ee_object, ee.image.Image):
            map_id_dict = ee.Image(ee_object).getMapId(vis_params)
            folium.raster_layers.TileLayer(
            tiles = map_id_dict['tile_fetcher'].url_format,
            attr = 'Google Earth Engine',
            name = name,
            overlay = True,
            control = True
            ).add_to(self)

        # display ee.ImageCollection()
        elif isinstance(ee_object, ee.imagecollection.ImageCollection):
            ee_object_new = ee_object.mosaic()
            map_id_dict = ee.Image(ee_object_new).getMapId(vis_params)
            folium.raster_layers.TileLayer(
            tiles = map_id_dict['tile_fetcher'].url_format,
            attr = 'Google Earth Engine',
            name = name,
            overlay = True,
            control = True
            ).add_to(self)

        # display ee.Geometry()
        elif isinstance(ee_object, ee.geometry.Geometry):
            folium.GeoJson(
            data = ee_object.getInfo(),
            name = name,
            overlay = True,
            control = True
        ).add_to(self)

        # display ee.FeatureCollection()
        elif isinstance(ee_object, ee.featurecollection.FeatureCollection):
            ee_object_new = ee.Image().paint(ee_object, 0, 2)
            map_id_dict = ee.Image(ee_object_new).getMapId(vis_params)
            folium.raster_layers.TileLayer(
            tiles = map_id_dict['tile_fetcher'].url_format,
            attr = 'Google Earth Engine',
            name = name,
            overlay = True,
            control = True
        ).add_to(self)

    except:
        print("Could not display {}".format(name))


# Add EE drawing method to folium.
folium.Map.add_ee_layer = add_ee_layer
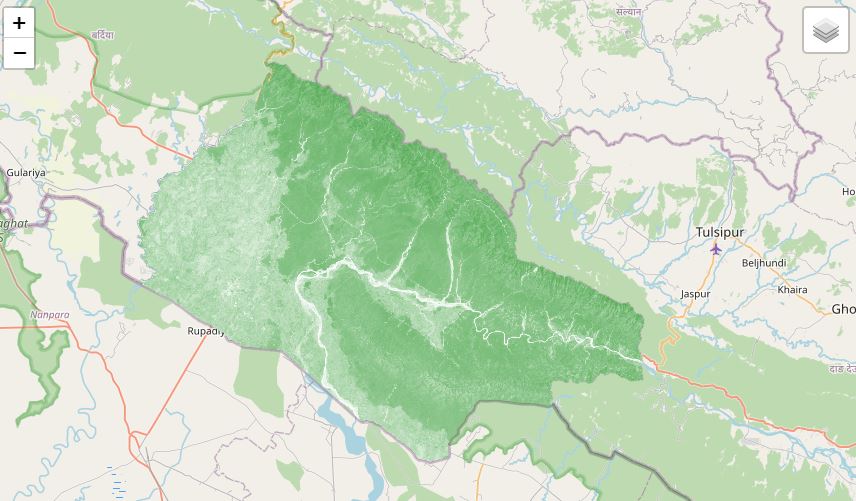
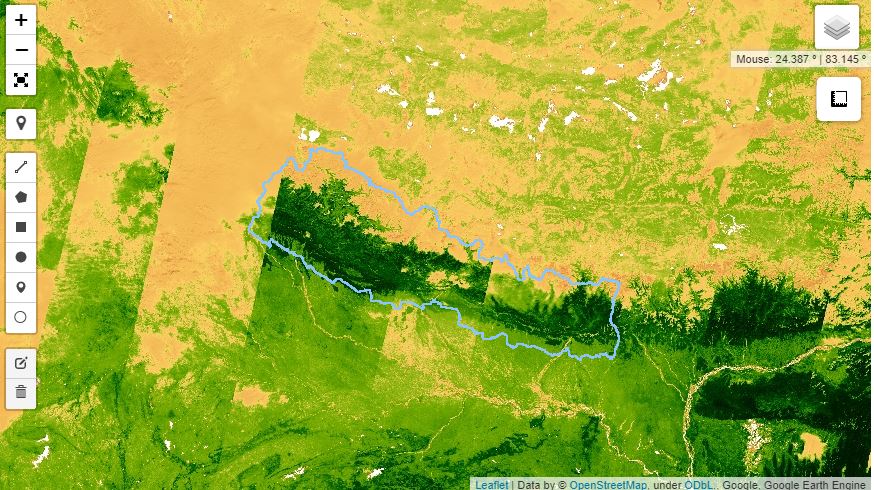
Now add the GEE images. In this example we use Sentinal data
#sentinal DATA for NDVI
S2 = ee.ImageCollection('COPERNICUS/S2').filterDate(startdate,enddate);

#Function to calculate and add an NDVI band
def addNDVI(image):
    return image.addBands(image.normalizedDifference(['B8', 'B4']));


#Add NDVI band to image collection
S2 = S2.map(addNDVI);
SentinalNdvi = S2.select('nd')


# Set visualization parameters.
visParams = { 'min': 0.0,
  'max': 8000.0,
  'palette': [
    'FFFFFF', 'CE7E45', 'DF923D', 'F1B555', 'FCD163', '99B718', '74A901',
    '66A000', '529400', '3E8601', '207401', '056201', '004C00', '023B01',
    '012E01', '011D01', '011301'
  ],}


# Add the data to the map object.
my_map.add_ee_layer(SentinalNdvi, visParams , 'Sential NDVI')

# Display the map.
display(my_map)
Get all the code in the GitHub
Responses

Sristi Suman
Your Comment...
- May 08, 2020 |
Nishan Kumar Biswas
Excellent work!
- May 14, 2020 |
Neha Sharma
Superb Work
- Jul 08, 2021 |
Iqbal
Excellent tutorial but I might have some problem. for the second step for showing the terrain, it doesn't show anything. But the code is normally run.
- Feb 02, 2022 |
Admin
Iqbal can you explain more on the problem. Is the map not visualized?
- Feb 08, 2022 |
Amir
Perfect
- Apr 28, 2022 |
Philipp
The Earth Engine team introduced now the FeatureView (https://developers.google.com/earth-engine/guides/featureview_overview). How would you visualize the data in Folium?
- Oct 14, 2022 |
natalia
The map doesn't show and the code gives me this error: NameError Traceback (most recent call last) Input In [144], in <cell line: 2>() 1 #sentinal DATA for NDVI ----> 2 S2 = ee.ImageCollection('COPERNICUS/S2').filterDate(startdate,enddate); 4 #Function to calculate and add an NDVI band 5 def addNDVI(image): NameError: name 'ee' is not defined Thanks for your help
- Feb 16, 2024 |
yoga
'Google Satellite Hybrid': folium.TileLayer( tiles = 'https://mt1.google.com/vt/lyrs=y&x={x}&y={y}&z={z}', attr = 'Google', name = 'Google Satellite', overlay = True, control = True ), replace: 'Google Satellite Hybrid': folium.TileLayer( tiles = 'https://mt1.google.com/vt/lyrs=y&x={x}&y={y}&z={z}', attr = 'Google', name = 'Google Satellite Hybrid', overlay = True, control = True ),
- Apr 08, 2024 |