Land Cover Mapping - Part 2
Published on May 31, 2020 | Bikesh Bade | 3469 Views
Classification
Random forest supervised classification method is used in the study. Supervised classification is the technique most frequently used for the quantitative chemical analysis of remote sensing image data. The supervised classification has supported the thought that a user can select sample pixels in a picture that are representative of specific classes so direct the image processing software to use these training sites as references for the classification of all other pixels within the image. For more details on classification follow the link
Google Earth Engine Code
// get bands
var bands = image.bandNames()
print(bands)

// integers starting from zero in the training data.
var label = 'lcode'

// Overlay the points on the imagery to get training.
var trainings = image.select(bands).sampleRegions({
  collection: train,
  properties: [label],
  scale: 30
});
// The randomColumn() method will add a column of uniform random
// numbers in a column named 'random' by default.
var sample = trainings.randomColumn();


var split = 0.7;  // Roughly 70% training, 30% testing.
var training = sample.filter(ee.Filter.lt('random', split));
print(training.size());


// Random forest
var classifier = (ee.Classifier.smileRandomForest(15)
              .train({
                  features: training,
                  classProperty: label,
                  inputProperties: bands
                }));
var classified = image.classify(classifier);
print(classified);


// Get a confusion matrix representing resubstitution accuracy.
var trainAccuracy = classifier.confusionMatrix();
print('Resubstitution error matrix: ', trainAccuracy);
print('Training overall accuracy: ', trainAccuracy.accuracy());


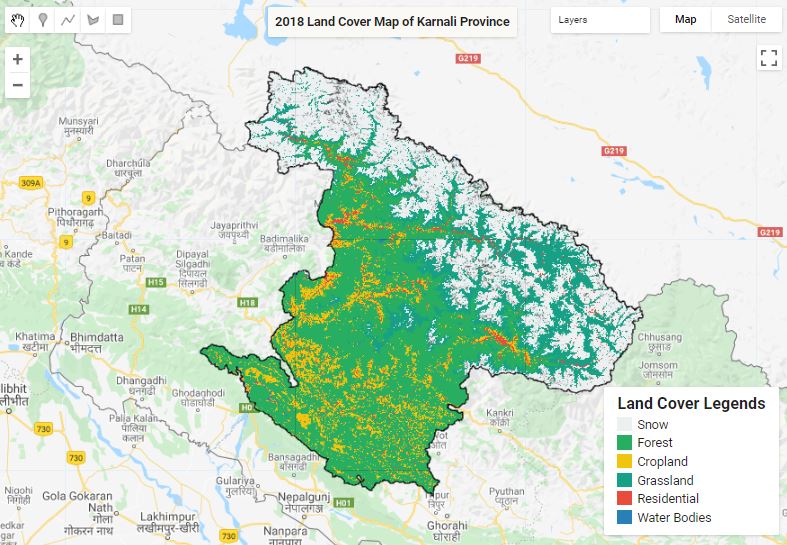
Map.addLayer(classified,{'min': 1, 'max': 6, palette: ['ecf0f1','27ae60', 'f1c40f','16a085','e74c3c','2980b9']},
            'classification');
Map User Interface (Title and Legend)
Beautify your map layout with inbuilt map user interface features:
Title
Map.add(ui.Label(
    '2018 Land Cover Map of Karnali Province',  {
      fontWeight: 'bold', BackgroundColor: 'FBF9F5',fontSize: '14px'}));
Legend
var names = ['Snow', 'Forest', 'Cropland','Grassland', 'Residential', 'Water Bodies' ];

var values = [ '1', '2', '3','4','5','6' ];

var legendsPalette = ['ecf0f1','27ae60', 'f1c40f','16a085','e74c3c','2980b9'];

// set position of panel
var legend = ui.Panel({style: { position: 'bottom-right', padding: '8px 15px'}});

// Create legend title
var legendTitle = ui.Label({value: 'Land Cover Legends ',style: {
  fontWeight: 'bold', fontSize: '18px', margin: '0 0 4px 0', padding: '0' }});

// Add the title to the panel
legend.add(legendTitle);

var makeRow = function(color, name) {
  // Create the label that is actually the colored box.
  var colorBox = ui.Label({
    style: {
      backgroundColor: '#' + color, padding: '8px',margin: '0 0 4px 0'} });

  // Create the label filled with the description text.
  var description = ui.Label({
    value: name, style: {margin: '0 0 4px 6px'}});

  // return the panel
  return ui.Panel({
    widgets: [colorBox, description],layout: ui.Panel.Layout.Flow('horizontal')})};

// Add color and and names
for (var i = 0; i < 6; i++) {
  legend.add(makeRow(legendsPalette[i], names[i]));
  }

// Add the legend to the map.
Map.add(legend);
