Extract CHIRPS rainfall data in excel for given survey points
Published on Nov 28, 2020 | Bikesh Bade | 4542 Views
Climate Hazards Group InfraRed Precipitation with Station data (CHIRPS) is a 35+ year quasi-global rainfall data set. Spanning 50°S-50°N (and all longitudes) and ranging from 1981 to near-present, CHIRPS incorporates our in-house climatology, CHPclim, 0.05° resolution satellite imagery, and in-situ station data to create gridded rainfall time series for trend analysis and seasonal drought monitoring.
Before jumping to the Google Earth Engine Coding, you should be familiar with the basic JavaScript syntax and its general coding style. Follow the Link
You can extract rainfall data from chirps images from Earth Engine. The exports can be sent to your Google Drive account, to Google Cloud Storage, or to a new Earth Engine asset.
Step 1: Import CHIRPS data
// import image collection
var chirps = ee.ImageCollection("UCSB-CHG/CHIRPS/DAILY")
Then, sum the precipitation data for the time frame required
// Sum data
chirps = chirps.filterDate(startDate,endDate).sum()
Step 2: Extract data
To extract data from the image in Google Earth Engine, there is a function called reduce region which intakes the point features and extracts the pixel value at the point. you can follow the link to get more informations.
// Surveydata is gps data
var precipitationData = data.reduceRegions({
  collection: surveydata,
  reducer: ee.Reducer.mean(),
  scale: 5000,
});
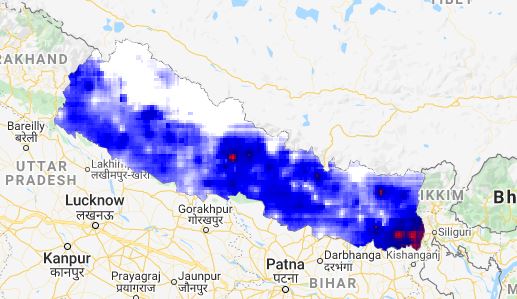
Step 3: Add images to the map
// add map
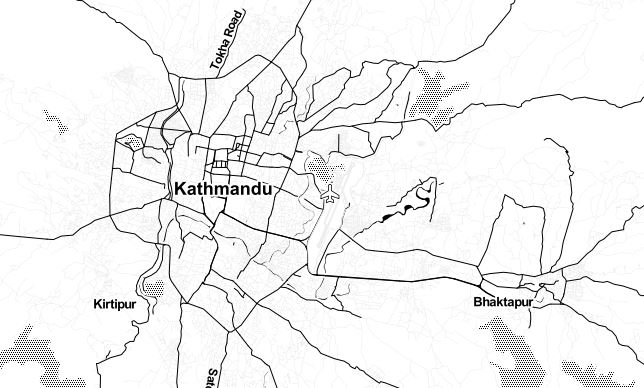
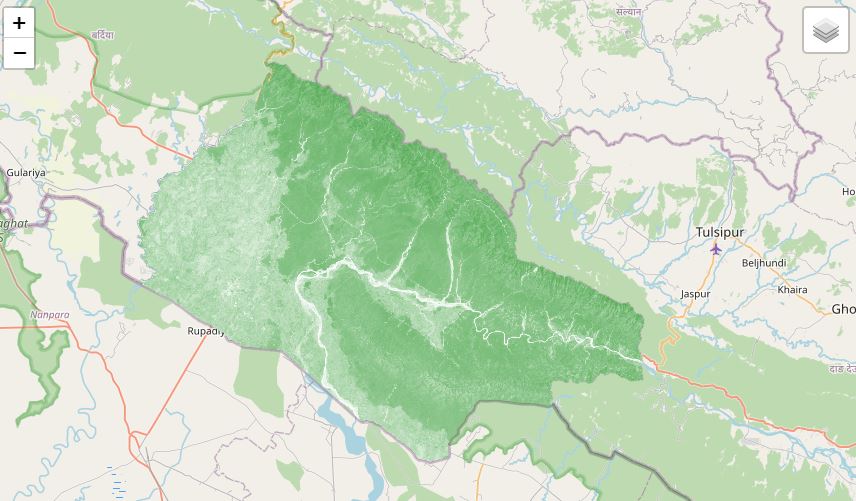
var data = chirps.clip(studyArea)
Map.centerObject(studyArea);
Map.addLayer(data,{min:1000,max:3500,palette:"white,blue,darkblue,red,purple"},"prepcipitation");
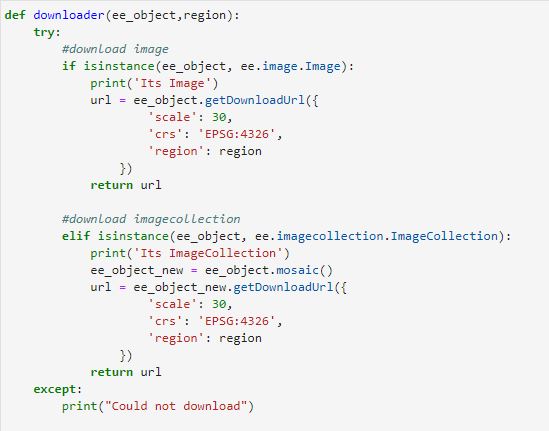
Step 4: Export
// export data to drive
Export.table.toDrive({
    collection: precipitationData,
    description: 'precipitationData',
    folder: 'GEE',
    fileNamePrefix: 'precipitationData',
    fileFormat: 'CSV'
})
Get the code in the link
Responses

Iqbal
I wonder for your Extract data on your collection data or surveydata. Does the data is in csv file with points then you convert it to shapefile and uploaded to the assets in GEE? Because I follow the step above there are some error: Line 8: Cannot read property 'reduceRegions' of undefined could you help or give some suggestion?
- Feb 01, 2022 |
Admin
Yes, survey data is a CSV file containing lat and long. its uploaded to the assets in the GEE
- Apr 18, 2022 |
Mulugeta
Hiw can this works for specific coordinates in a watershed?
- Jun 19, 2022 |