Chirps Precipitation to Excel - GEE and Pandas
Published on Apr 29, 2020 | Bikesh Bade | 5013 Views
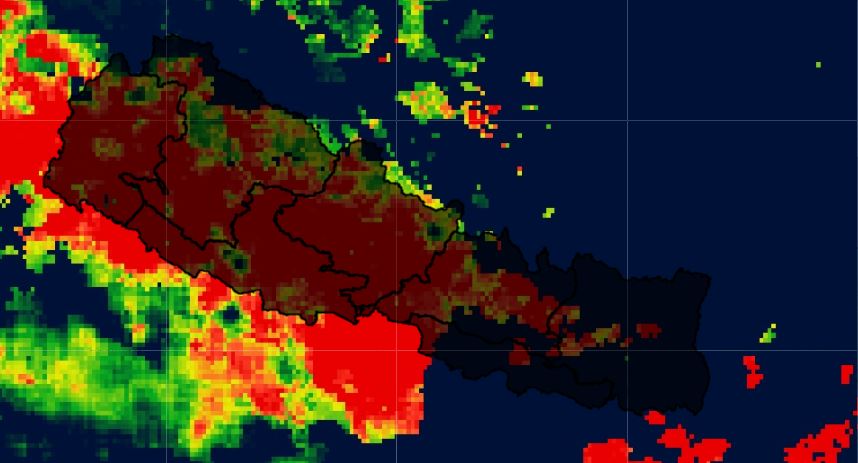
ExtractClimate Hazards Group InfraRed Precipitation with Station data (CHIRPS) is a 30+ year quasi-global rainfall dataset using Google earth engine API and convert it into. Excel and charts using Python Pandas data frame.
The simplest way to convert CHIRPS into excel or CSV is to infuse the panda's data frame with GEE python API. To infuse the ee.CHIRPS using python API, first you have to set up a python environment in your local computer.
Set up Python API for GEE and continue following
Step 1
The Python API package is called ee. It must also be initialized for every new session and script. and import other necessary modules such as pandas, Matloplib, Numpy
# import Google earth engine module
import ee

#Authenticate the Google earth engine with google account
ee.Initialize()


#Pandas modules to interact data
import numpy as np
import pandas as pd
import matplotlib.pyplot as plt
%matplotlib inline
Step 2
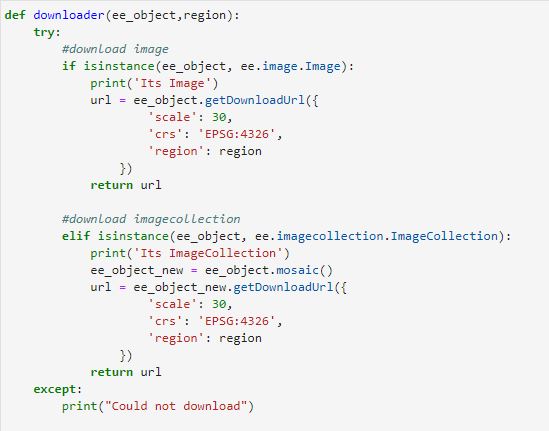
Create a Python function to convert CHIRPS image collections:
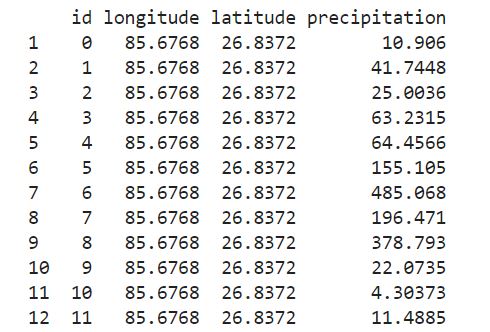
# import the RS products
chirps = ee.ImageCollection('UCSB-CHG/CHIRPS/PENTAD')

# Define time range
startyear = 2019
endyear = 2020

# Set date in ee date format
startdate = ee.Date.fromYMD(startyear,1,1)
enddate = ee.Date.fromYMD(endyear+1,12,31)


# create list for years
years = range(startyear,endyear);

# make a list with months
months = range(1,13)

#Filter to select Precipitation band
PrecipitationChirps = chirps.filterDate(startdate, enddate).sort('system:time_start', False).select("precipitation")

# Define geograpic
point = ee.Geometry.Point([85.68, 26.91])

# calculate the monthly Sum
def MonthlySum(imageCollection):
    mylist = ee.List([])
    for y in years:
        for m in months:
            w = imageCollection.filter(ee.Filter.calendarRange(y, y, 'year')).filter(ee.Filter.calendarRange(m, m, 'month')).sum()
            #mylist = mylist.add(w)
            mylist = mylist.add(w.set('year', y).set('month', m).set('date', ee.Date.fromYMD(y,m,1)).set('system:time_start',ee.Date.fromYMD(y,m,1)))
    return ee.ImageCollection.fromImages(mylist)

# run the calcMonthlyMean function
monthlyChirps = ee.ImageCollection(MonthlySum(PrecipitationChirps))


# select the region of interest, 25000 is the cellsize in meters
monthlyChirps = monthlyChirps.getRegion(point,25000,"epsg:4326").getInfo()


# get january (index = 0)
precipiation = pd.DataFrame(monthlyChirps, columns = monthlyChirps[0])


# remove the first line
precipiation = precipiation[1:]

#to display the data
print(precipiation[['id','longitude','latitude','precipitation']])


#To export to CSV
precipiation.to_csv (r'C:\bikesh\Code\GEE\mywork\Chirps\precipitation.csv', index = False, header=True)
Step 3
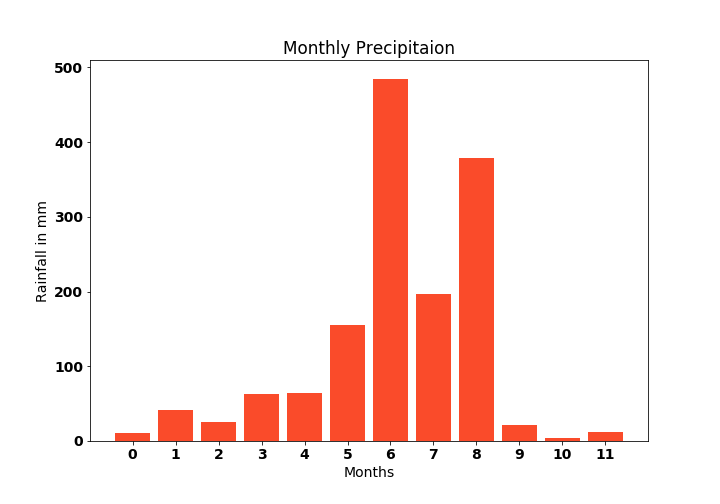
The final step is to create a chart with precipitation data
# To display the data in the chart
#style the font size
font = {'family' : 'normal',
        'weight' : 'bold',
        'size'   : 14}
plt.rc('font', **font)

#chart Title
plt.title('Monthly Precipitaion')

#chart lable for x axis
plt.xlabel('Months')

#chart lable for y axis
plt.ylabel('Rainfall in mm')

#chart size and data assign
plt.bar(January['id'], January['precipitation'], color='#fa4b2a')
plt.rcParams["figure.figsize"] = (10,7)

#export chart as png
plt.savefig('precipitation.png')
Get all the code in the GitHub in the formate of Jupyter notebook
Responses

Claudette
Donnez vous des formations en ligne ?
- May 01, 2020 |
Admin
si tu veux je peux te donner la formation
- May 02, 2020 |
Mulugeta
Are there any scripts that can extract daily rainfall?
- Jan 27, 2022 |
Admin
Currently there no such script but in future will create some scripts.
- Feb 08, 2022 |