Calculate NDVI from Sentinel-2 with Python API
Published on May 07, 2020 | Bikesh Bade | 11785 Views
The Normalized Difference Vegetation Index (NDVI) is a simple graphical indicator that can be used to analyze remote sensing measurements, typically, but not necessarily, from a space platform, and assess whether the target being observed contains live green vegetation or not.
Set up Python API for GEE and continue following
The Python API package is called ee. It must also be initialized for every new session and script.
# import Google earth engine module
import ee

# Authenticate the Google earth engine with google account
ee.Initialize()
NDVI value ranges between -1.0 and +1.0. Generally speaking, NDVI shows a functional relationship with vegetation properties (e.g. biomass). NDVI is directly related to the photosynthetic capacity and energy absorption of plant canopies. The NDVI is calculated from these individual measurements as follows:
NDVI= (NIR-Red) \ (NIR+Red)
To know more on NDVI follow the link
Let's import the Sentinel Satellite data for NDVI. With the Python API, we can create the function which can be used multiple times to import data.
#name of bands
inBands = ee.List(['QA60','B2','B3','B4','B5','B6','B7','B8','B8A','B9','B10','B11','B12']);
outBands = ee.List(['QA60','blue','green','red','re1','re2','re3','nir','re4','waterVapor','cirrus','swir1','swir2']);

CloudCoverMax = 20

#function to get the data
def importData(studyArea,startDate,endDate):

    # Get Sentinel-2 data
    s2s =(ee.ImageCollection('COPERNICUS/S2')
          .filterDate(startDate,endDate)
          .filterBounds(studyArea)
          .filter(ee.Filter.lt('CLOUDY_PIXEL_PERCENTAGE',CloudCoverMax))
          .filter(ee.Filter.lt('CLOUD_COVERAGE_ASSESSMENT',CloudCoverMax)))

    #sentinel bands are in scale of 0.0001
    def scaleBands(img):
        prop = img.toDictionary()
        t = (img.select(['QA60','B2','B3','B4','B5','B6','B7','B8','B8A','B9','B10','B11','B12'])
             .divide(10000))
        t = (t.addBands(img.select(['QA60'])).set(prop)
            .copyProperties(img,['system:time_start','system:footprint'])

        return ee.Image(t))


    s2s = s2s.map(scaleBands)
    s2s = s2s.select(inBands,outBands)

    return s2s
Now call the function to import data with proper name and scale
startyear = 2019
endyear = 2019
startDate = ee.Date.fromYMD(startyear,1,1)
endDate = ee.Date.fromYMD(endyear,12,31)
#gee assets to get the study area
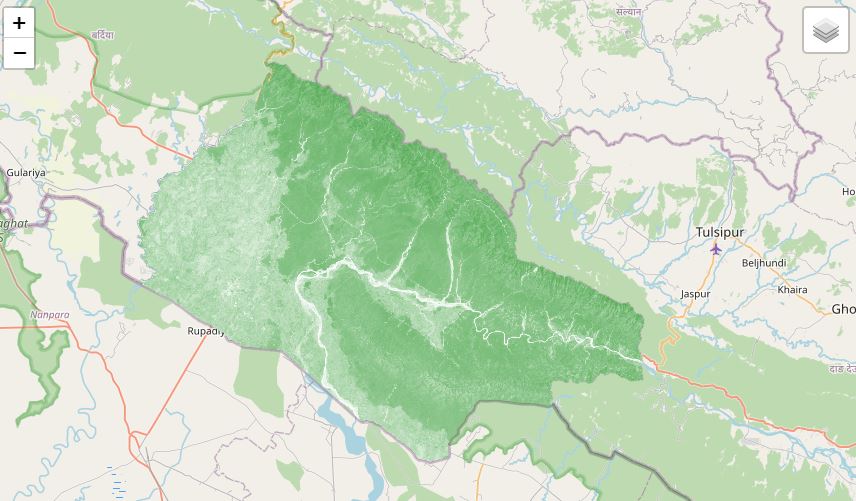
studyArea = ee.FeatureCollection('users/bikesbade/bankey/banke')
print("Getting images")
s2 = importData(studyArea, startDate,endDate)
s2 = s2.median().clip(studyArea)
The final step is to get the NDVI. let's go for the function-based to get the NDVI, which will be helpful for future reference and multiple uses.
# get indexes
def getNDVI(image):

    # Normalized difference vegetation index (NDVI)
    ndvi = image.normalizedDifference(['nir','red']).rename("ndvi")
    image = image.addBands(ndvi)

    return(image)
Call the NDVI as
#get Indexes
print("getting indexes")
s2 = getIndexes(s2)
For Visualization please follow the
Beginner guide to python Folium module to integrate google earth engine and continue following
Get all the code in the GitHub
Responses

Iqbal
I have some problem with the second script: #name of bands inBands = ee.List(['QA60','B2','B3','B4','B5','B6','B7','B8','B8A','B9','B10','B11','B12']); outBands = ee.List(['QA60','blue','green','red','re1','re2','re3','nir','re4','waterVapor','cirrus','swir1','swir2']); CloudCoverMax = 20 #function to get the data def importData(studyArea,startDate,endDate): # Get Sentinel-2 data s2s =(ee.ImageCollection('COPERNICUS/S2') .filterDate(startDate,endDate) .filterBounds(studyArea) .filter(ee.Filter.lt('CLOUDY_PIXEL_PERCENTAGE',CloudCoverMax)) .filter(ee.Filter.lt('CLOUD_COVERAGE_ASSESSMENT',CloudCoverMax))) #sentinel bands are in scale of 0.0001 def scaleBands(img): prop = img.toDictionary() t = (img.select(['QA60','B2','B3','B4','B5','B6','B7','B8','B8A','B9','B10','B11','B12']) .divide(10000)) t = (t.addBands(img.select(['QA60'])).set(prop) .copyProperties(img,['system:time_start','system:footprint']) return ee.Image(t)) s2s = s2s.map(scaleBands) s2s = s2s.select(inBands,outBands) return s2s the eror is : return ee.Image(t)) ^ SyntaxError: invalid syntax
- Feb 02, 2022 |
Admin
There seems some syntax error. Can you connect with me on email.
- Feb 08, 2022 |