Calculate NDVI and export
Published on May 19, 2020 | Bikesh Bade | 3534 Views
Normalized Difference Vegetation Index (NDVI) quantifies vegetation by measuring the difference between near-infrared (which vegetation strongly reflects) and red light (which vegetation absorbs).
You can export images, map tiles, tables, and videos from Earth Engine. The exports can be sent to your Google Drive account, to Google Cloud Storage, or to a new Earth Engine asset.
Step 1: Import two sentinel-2 images
var s2 = ee.ImageCollection('COPERNICUS/S2')
.filterDate('2019-01-01', '2019-12-30')
.filter(ee.Filter.lt('CLOUDY_PIXEL_PERCENTAGE', 20))
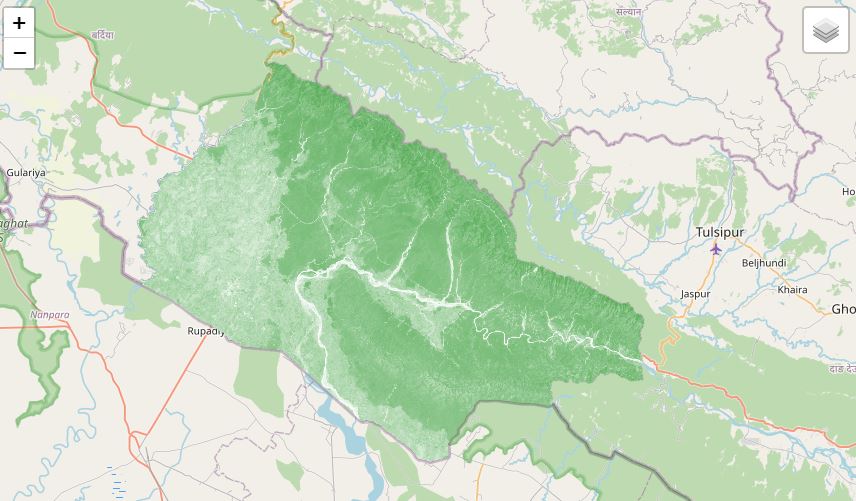
.filterBounds(studyArea); //choose your own study Area
Step 2: Calculate the NDVI
//  Normalized difference vegetation index (NDVI)
function getNDVI (image) {
    var ndvi = image.normalizedDifference(['B8','B4']).rename("ndvi");
    image = image.addBands(ndvi);
    return image;
}
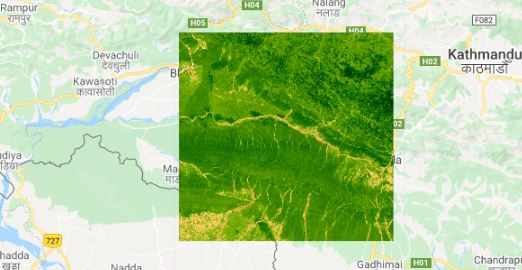
Step 3: Add images to the map
//create composite with reducer median
s2 = s2.median();

//get NDVI
s2 = getNDVI(s2).clip(studyArea);

//select NDVI layer
var s2NDVI = s2.select('ndvi');

//get infromation of the images
print(s2);


// visualization
var ndviVis = {
  min: 0.0,
  max: 0.8,
  palette: [
    'FFFFFF', 'CE7E45', 'DF923D', 'F1B555', 'FCD163', '99B718', '74A901',
    '66A000', '529400', '3E8601', '207401', '056201', '004C00', '023B01',
    '012E01', '011D01', '011301'
  ],
};


var rgbVis = {
  min: 0.0,
  max: 0.3,
  bands: ['B4', 'B3', 'B2'],
};


//add to map
Map.centerObject(studyArea, 9);
Map.addLayer(s2, rgbVis, 'Sentinel');
Map.addLayer(s2NDVI, ndviVis, 'NDVI');
Step 4: Export
Export.image.toDrive({
  image: s2NDVI,
  scale:10,
  description: 'NDVI',
  region: studyArea,
});
Get the code in the link
Responses

Adnane Labbaci
How can you export the result directly to your computer, not to your drive
- May 31, 2020 |
TARIQ BADSHAH
Your Comment...
- Mar 07, 2022 |
Admin
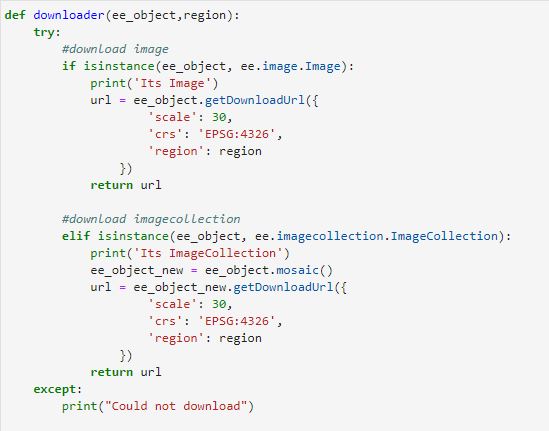
please check this link for direct download to your computer. PS there is a limitation in GEE on export. https://bikeshbade.com.np/tutorials/Detail/?title=Export%20Google%20Earth%20Engine%20Images%20directly%20to%20your%20computer.&code=6
- Apr 09, 2022 |
amal
Hello, please how can I export NDVI maps for each years with time series
- Oct 11, 2022 |